One thing is definitely bipartisan: all politicians take liberties with economic data and use it selectively to make their cases.
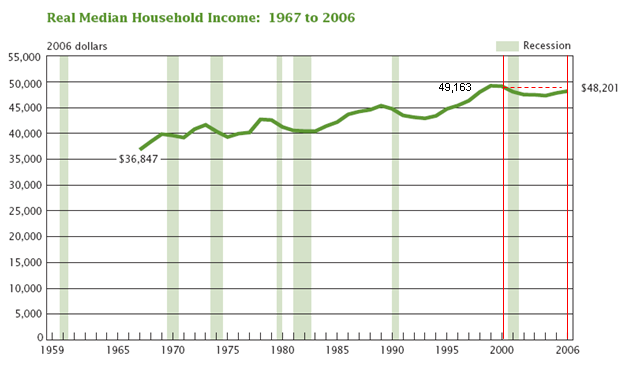
Most recently, Senator Obama has been stumping that median real household income grew under President Clinton, and fell by over $1,000 because of President Bush’s policies.
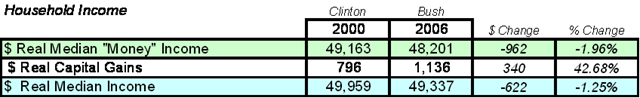
Taken literally, that’s true. Reported median real household income declined from $49,163 in 2000 (Clinton’s last year in office) to $48,201 in 2006 (the most recently available data).
http://www.heritage.org/research/features/BudgetChartBook/index.html
Now, some folks (i.e. Republicans) might argue that the Clinton years’ gains were more attributable to the harvesting of the Reagan tax cuts and a coincidental internet-technology boom. And, some folks (again, Republicans) might point out that Clinton handed Bush an economy that was, by generally accepted measures, in a the early stages of a recession that was subsequently deepened by the 9/11 crisis and its aftermath. So, some of Clinton’s apparent gains may have been windfalls, and Bush may have been dealt a bad opening hand. So be it. That’s life in the oval office.

http://www.heritage.org/research/features/BudgetChartBook/index.html
* * * * *
Putting aside the debatable qualitative aspects of the change in median real household income, what does the underlying hard data say ?
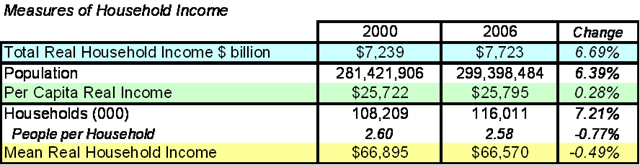
Starting from the very top, aggregate real income — the total income across all households, adjusted for inflation — grew 6.7% from 2000 to 2006 — going from $7.2 trillion to $7.7 trillion. During that same period, the U.S. population grew 6.4% — from 281.4 million in 2000 to 299.4 million in 2006. So, doing some simple arithmetic, real income per capita was flat from 2000 to 2006 — $25,722 to $25,795. In other words, real income kept pace with population growth.
During that same period, the number of households grew 7.2% — faster than population — going from 108.2 million in 2000 to 116.0 million in 2006. Households got slightly smaller — 2.58 people per household in 2006, versus 2.60 in 2000. Why? Some couples had fewer children, and some households split-up with multiple wage earners forming separate household units.
So, despite an increase in aggregate real income, the average — mean real household income — declined slightly , going from $66,895 to $66,570.
* * * * *
Importantly, for several reasons, mean real household income isn’t a particularly good criteria. It is an incomplete and misleading measure of families’ economic well-being.
First, most analysts would agree that when statistical distributions are highly skewed (such as income data with many folks at the bottom and relatively few at the very top), the median — the 50th percentile mark that splits the population into a top and a bottom halves — is a more representative measure than the mean, which is a simple average of all folks.
So, from a strictly statistical perspective, it makes sense that Obama is touting a median. The criteria he selects is median real household income — which dropped from $49,163 in 2000 to $48,201 in 2006.
But, that narrow metric has some glaring flaws: It doesn’t include some items that contribute to household income and, most important, it is pre-tax. It doesn’t account for the taxes that the government takes out.
More specifically, median real household income isn’t all inclusive. The commonly reported measure of household income — the one Obama cites — is what’s called “money income” — i.e., wages and transfer payments. Money income doesn’t include common income items such as capital gains. By just including capital gains, the median real household income gap between 2000 and 2006 narrows by a third.
Note: Capital gains data is from Tax Foundation estimates:
http://www.taxfoundation.org/blog/show/23411.html
* * * * *
And, even more important, the median real household income metric is pre-tax.
Since families can only spend after-tax income, it is somewhere between disingenuous and intellectually dishonest to ignore tax benefits inyear-to-year comparisons. This is particularly true in this case since the core of the Bush economic program is lower taxes.
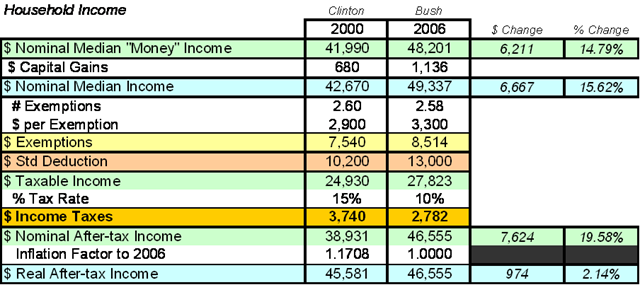
While the Bush tax plan is often demonized as being just for the rich, it also includes substantial benefits for folks in the lowest tax brackets. For example, the low bracket marginal income tax rate was cut from 15% to 10% , the personal exemption allowance has been increased from $2,900 in 2000 to $3,300 in 2006, and the standard deduction has been increased from $10,200 in 2000 to $13,000 in 2006 (for joint filing married couples).
Median after-tax real household income isn’t commonly reported. But, it can be estimated by simply running the reported median real household income through each year’s tax tables.
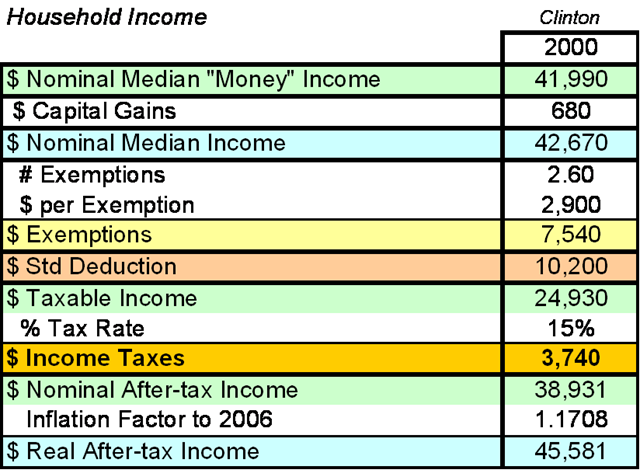
In 2000, nominal median household money income — unadjusted for inflation — was $41,990. Estimated nominal household capital gains were $680, so nominal median household income (including capital gains) was $42,670.
Since there were an average of 2.6 people per household in 2000, the estimated allowance for personal exemptions would be $7,540 — 2.6 times the $2,900 allowance per personal exemption in 2000.
The standard deduction for married couples filing jointly in 2000 was $10,200. Subtracting the personal exemptions allowance ($7,540) and the standard deduction ($10,200) from the median nominal household income ($42,670), nets to a taxable income of $24,930.
Since $24,930 was within the 15% marginal tax bracket in 2000, income taxes — ignoring, for simplicity, any child or earned income tax credits –would be $3,740 and median nominal after tax income would be $38,931.
Adjusting for inflation — that is, expressing the answer in 2006 dollars — estimated median real household after-tax median income would be $45,581.
* * * * *
How does 2006’s median real household after-tax median income rack-up against 2000’s ?
Well, taking into account Bush’s higher personal exemption allowance, the higher standard deduction, and the lower marginal tax rate — 10% versus 15% — the answer reverses ! Median real after-tax household income went up 2% — about 2% or $1,000 per household — from the end of the Clinton administration in 2000 to the latest reported data (2006).
For sure, that puts a different paint job on the picture.
Note: An excellent analysis by Gerald Prante of the Tax Foundation — “Has Real Median Household Income Fallen Since 2000?” — traces through the inclusion or exclusion of other income adjustments. For example, including the imputed value of employer paid health insurance increases the 2006 real advantage by over $700 per household; payroll taxes on the higher income reduces the 2006 advantage by about $200.
http://www.taxfoundation.org/blog/show/23411.html
* * * * *
Now, some folks (Democrats) might say that 2006 isn’t relevant since the economy has been in a slump since then. True, but the effect probably isn’t enough to re-reverse the answer. We’ll see when the data comes out.
Until then the most reasonable fact-based conclusion is that median real after-tax household income went up between 2000 and 2006, and Senator Obama’s claims are, in their best light, misleading.
* * * * *
Want more from the Homa Files?
Click link => The Homa Files Blog
* * * * *

April 25, 2009 at 12:00 pm |
Really interesting analysis that you’ve done on income and tax policy. One element that’s missing, though: The cost of Bush’s tax cuts on future generations, through higher deficits and greater national debt. The US national debt increased by about $4.5 trillion during the Bush administration. That’s about $1,700 of added cost of interest alone per household based on normalized US treasury rates. Factor that into tax policy and real incomes have come down. If you’re going to count lower taxes imposed on Americans, count the cost of going into a deficit as well.
One of Reagan’s biggest regrets was running a massive deficit. It should be Bush II’s regrets but I doubt it will. And I’m sure it will be for Obama, as well. At least Obama is running deficits to improve education and health care. Bush and Reagan ran deficits to build up the military, fight wars and increase wealth to the top 5% of income earners. Overall, great analysis though.